How has the Australian Residential Dwellings Performed?
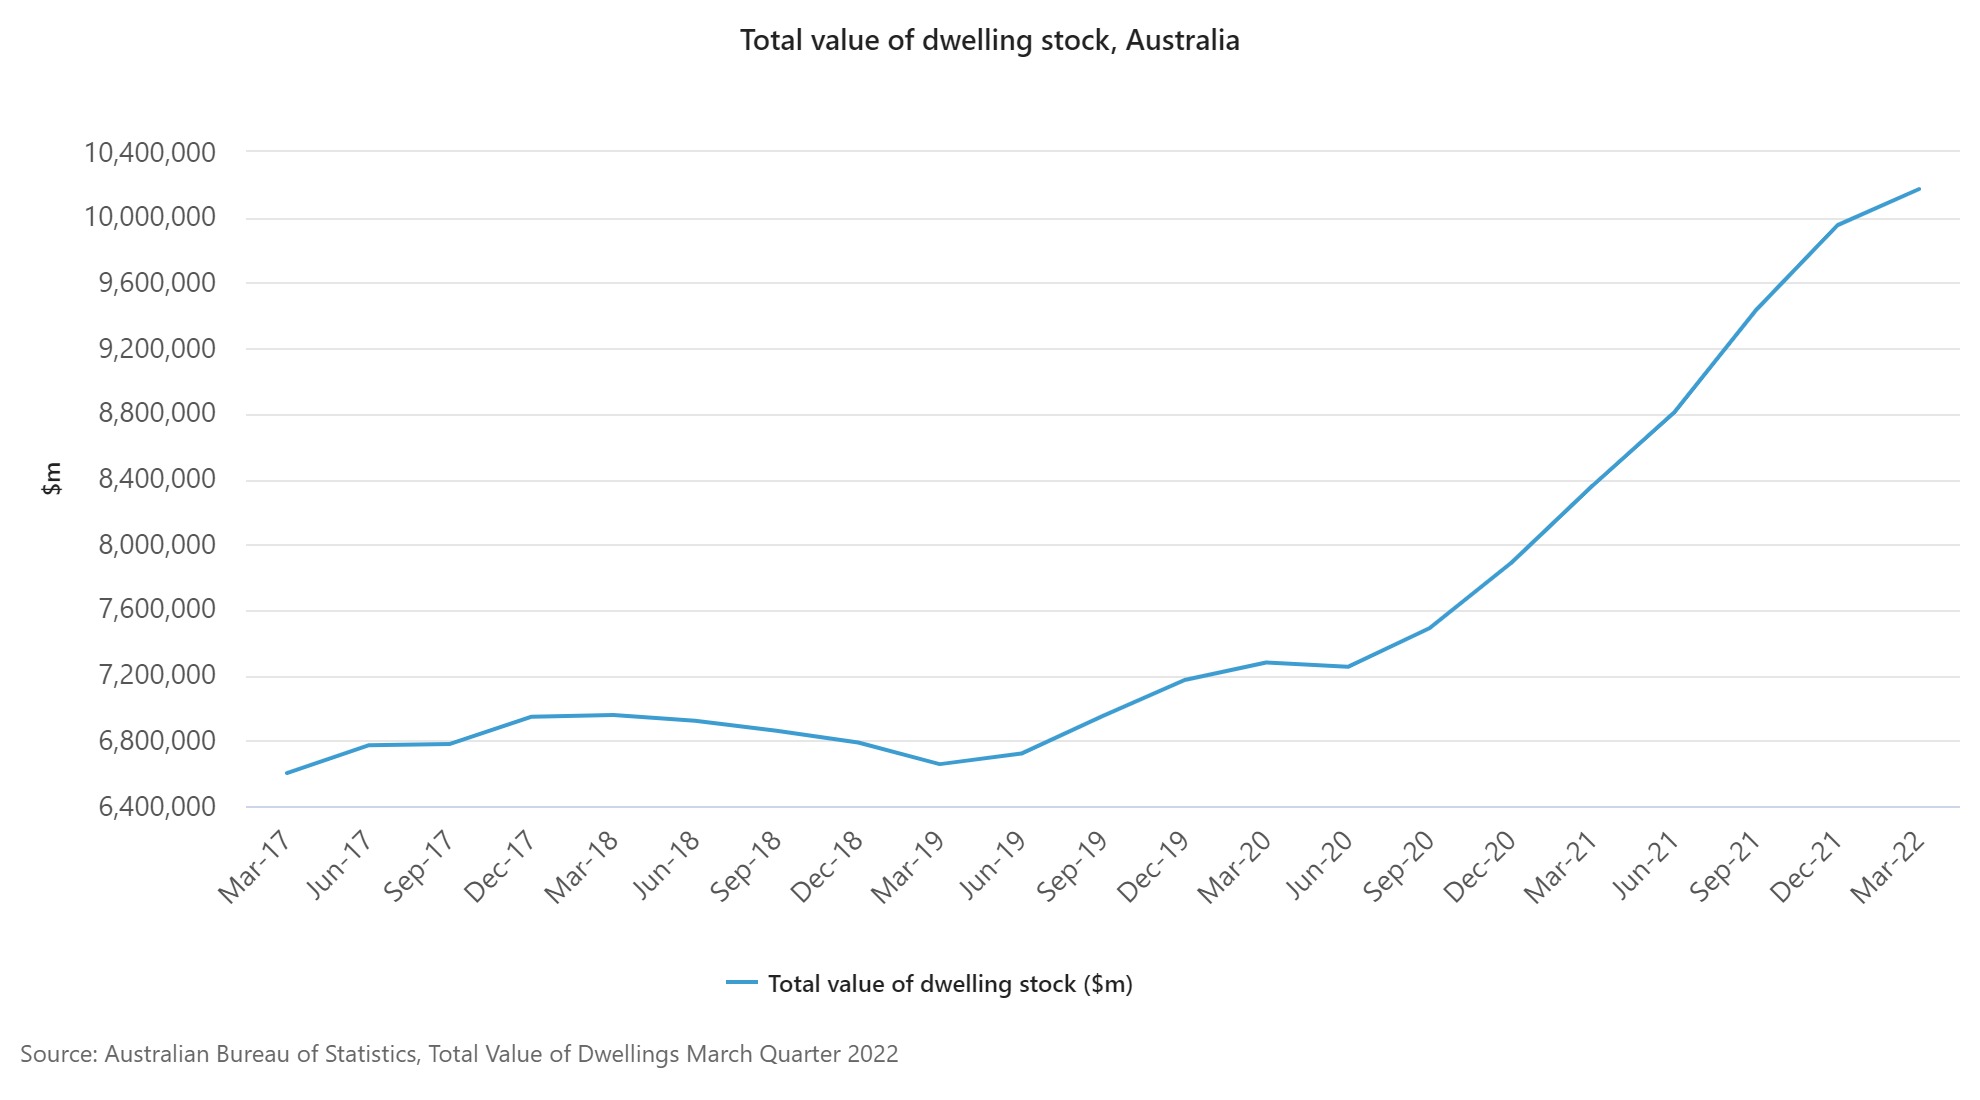
According to the ABS, the preliminary estimate of the total value of residential dwellings in Australia in the March quarter 2022 was $10,173.6 billion, up $221.2 billion from $9,952.4 billion in the December quarter 2021.
The total value of residential dwellings in Australia surpassed $10 trillion for the first time, rising $1.8 trillion in the past twelve months from $8.4 trillion in the March quarter 2021.
Of the total value of residential dwellings, $9,723.7 billion was owned by households.
The number of residential dwellings rose by 45,000 to 10,801,400, and the mean price of residential dwellings rose $16,600 to $941,900, this quarter.
The value of residential dwellings in NSW this quarter was $4,078.8 billion, approximately 40.1% of the total value of dwellings in Australia.
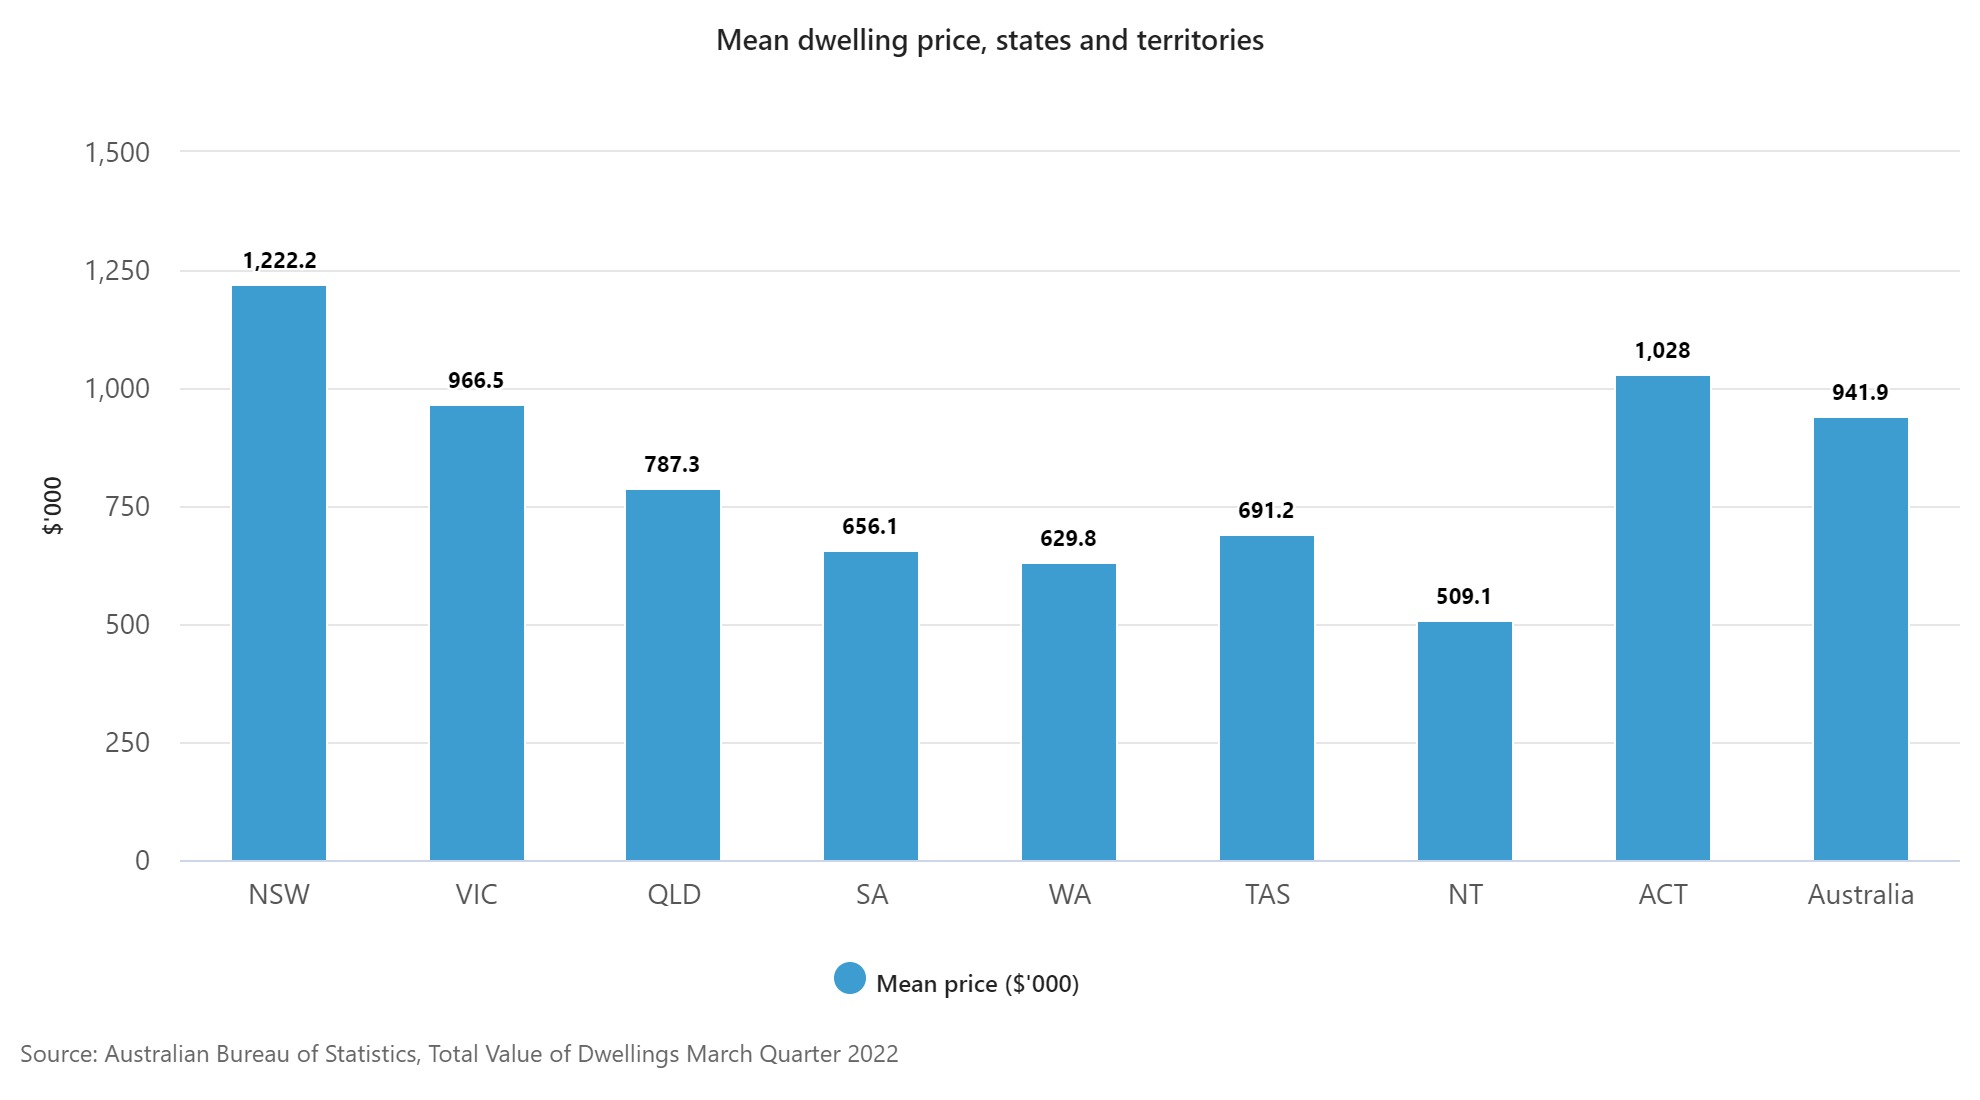
The mean price of residential dwellings in NSW rose by $6,800 to $1,222,200 during the March quarter 2022 and was the highest in the country. The second highest mean price was in the Australian Capital Territory ($1,028,000), followed by Victoria ($966,500). The lowest mean price ($509,100) was in the Northern Territory.
The median house price in Sydney rose by 16.4% to $1,245,000, and by 9.4% to $930,000 in Melbourne, over the twelve months to the March quarter 2022. Meanwhile, in regional NSW, the median house price increased 29.1% to $800,300, and by 17.4% to $640,000 in the Victorian regions.
Nationally, the strongest annual rises in median house prices were in regional Tasmania (+30.0%, to $520,000) and in Brisbane (+29.3%, to $787,500).
Over the last twelve months, the median price of attached dwellings rose by 1.3% to $770,000 in Sydney and by 0.2% to $631,000 in Melbourne. By comparison, the median attached dwelling price in regional NSW increased 16.3% to $686,100, while in regional Victoria it rose by 8.2% to $530,000.
Across the country, the strongest annual rises in median prices of attached dwellings were in Hobart (+24.1%, to $589,300) and Canberra (+24.0%, to $630,000).
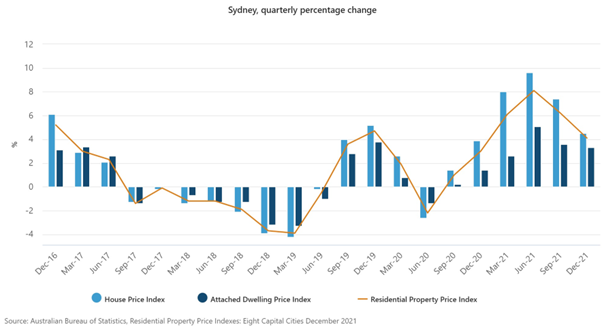
Residential Property Price Index
- rose 4.1% this quarter, following a rise of 6.2% in the September quarter 2021.
- rose 26.7% over the last twelve months. This is the largest annual rise since the commencement of the series.
House Price Index
- rose 4.5% this quarter, following a rise of 7.4% in the September quarter 2021.
- rose 32.9% over the last twelve months. This is the largest annual rise since the commencement of the series.
Price rises were observed across all market segments.
Attached Dwellings Price Index
- rose 3.3% this quarter, following a rise of 3.6% in the September quarter 2021.
- rose 15.5% over the last twelve months.
Price rises were most evident in the middle ($925,000 to $1.4m) segments of the market.
Where is the Residential Property Market moving towards?
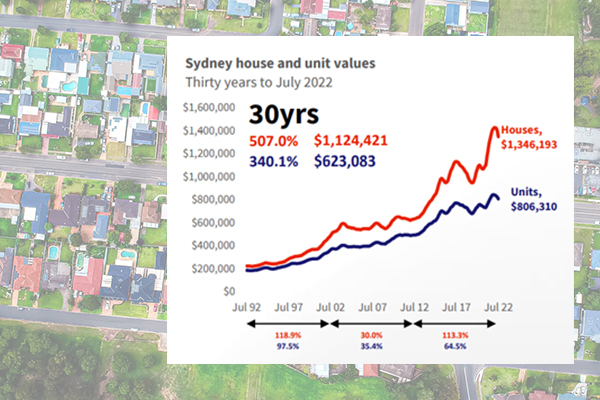
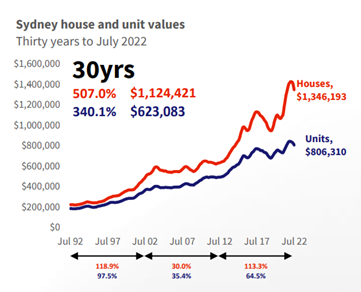
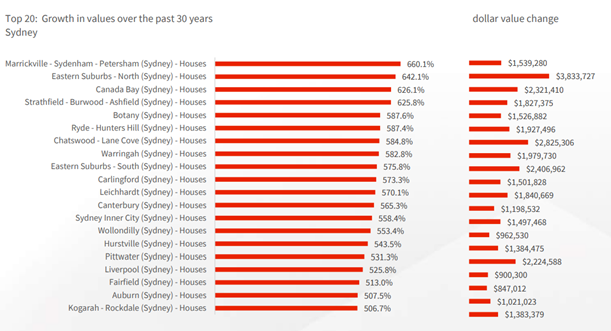
According to CORELogic Property Pulse, Over the past 30 years Sydney dwelling values have increased by 449% (5.8% per annum), with the 10 years ending July 2022 recording the highest rate of growth over the past three decades. The 30-year growth rate was the second highest of any capital city, after Melbourne (459%). In dollar terms, Sydney’s median house value has increased from approximately $221,770 in July 1992 to $1,346,190 in July 2022; an increase of approximately $1,124,420. Unit values are approximately $623,080 higher over the past 30 years, rising from $183,230 in 1992 to $806,310. The best performing sub-region of Sydney has been houses within the Marrickville-Sydenham–Petersham SA3, where values have risen by 660.1%, equating to an approximate dollar value gain of $1,539,280.
According to CORELogic Property Pulse survey the top 20 growth in values over the past 30yrs in Sydney is the following;
Patience is a virtue, especially when it comes to the Australian preference for residential property. Short-term trends may be the topic of conversation at a weekend barbeque and in the media, but Australians prefer to stay in their houses for far longer than a typical market cycle. For some context, the median hold duration (the number of years between individual home sales) in Australia was nine years for properties sold in the previous 12 months.
At the top of the most recent expansion cycle, about 617,300 properties were sold across Australia, the highest number of sales since 2003, although this translates to only 6.3% of Australian dwellings shifting over in a year, demonstrating that most home owners aren’t directly influenced by changing values.
Given the emphasis on the rise in property values during the pandemic, and the more recent decline in home value trends as interest rates increase, it’s interesting reviewing how much housing values have changed over time, particularly over the last three decades.
Over that 30-year span, the national index has undergone six distinct cycles of rise and an equal number of cycles of decline (including the present downturn). Taxation policy, monetary policy decisions, economic shocks, fiscal stimulus, and broader economic conditions have all played a role in each of the upswings and downturns.
While home values fluctuate in cycles of growth and collapse, the long-term trend is clearly upward. Over the last 30 years, national home values have climbed by 382% over the past 30 years, or in annual compounding terms, rising by 5.4% on average since July 1992.
At a macro level, the 1992-2002 era offered the greatest capital gains during the previous three decades, with CoreLogic’s national Home Value Index (HVI) growing by 77%. The national HVI increased by 59% during the middle decade (2002-2012), while national housing values increased by 72% during the most recent decade.
However, depending on local market conditions, there have been significant variances between regions. For example, during the mining boom and subsequent recession in Western Australia, Perth housing values increased by 104% between 2002 and 2012, but they are only 14% higher today (2012-2022).
In Hobart, the 1992-2002 era was the weakest of the three decades studied, with values increasing by 30%, while the most recent ten years were the strongest which has seen Hobart housing values surge 99% on the back of stronger migration and an ongoing undersupply of housing.
Long-term patterns emphasize the cyclical character of housing markets. Housing value changes over decades serve as a stark reminder that time in the market is more important than timing the market.